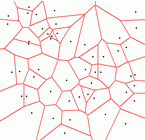
Example Delaunay Diagram
|
The following program generates a list
On the right you see a screenshot of the program showing the Delaunay
diagram. Clicking on the picture shows the |
 |
#include <LEDA/core/list.h>
#include <LEDA/geo/rat_point.h>
#include <LEDA/geo/rat_circle.h>
#include <LEDA/geo/random_rat_point.h>
#include <LEDA/graphics/window.h>
#include <LEDA/geo/geo_alg.h>
#include <LEDA/graph/edge_array.h>

using namespace leda;

int main()
{
  list<rat_point> L;
  random_points_in_square(50,100,L);

  GRAPH<rat_circle,rat_point> G;

  delaunay_voronoi_kind kind;

  VORONOI(L,G);
  kind=NEAREST;

  //F_VORONOI(L,G);   //Furthest Point Voronoi Diagram
  //kind=FURTHEST;

  if (Is_Voronoi_Diagram(G,kind))
	  std::cout << "G is a Voronoi Diagram" << std::endl;
  else std::cout << "WARNING: G is no Voronoi Diagram!" << std::endl;

  window W;
  W.init(-110,110,-110);
  W.open(); W.display();
  W.set_node_width(2);
  W.set_line_width(2);

  std::cout << "Nodes of Voronoi diagram" << std::endl;
  edge e;
  forall_edges(e,G) {
    point p=G[e].to_point();W.draw_filled_node(p);
  }
  W.read_mouse();

  std::cout << "Edges of Voronoi diagram" << std::endl;
  edge_array<bool> drawn(G,false);
  forall_edges(e,G) {
    if (drawn[e]) continue;

    drawn[G.reversal(e)] = drawn[e] = true;

    node v = source(e); node w = target(e);

    if (G.outdeg(v) == 1 && G.outdeg(w) == 1) {
      //special case: exactly two sites
      rat_line l = p_bisector(G[v].point1(),G[v].point3());
      W.draw_line(l.to_line(),red);
    }

    else if (G.outdeg(v) == 1) { //v at infinity
      rat_point  cw  = G[w].center();
      rat_vector vec = G[v].point3() - G[v].point1();
      rat_point  cv  = cw + vec.rotate90();
      W.draw_ray(cw.to_point(),cv.to_point(),red);
    }

    else if (G.outdeg(w) == 1) { //w at infinity
      rat_point  cv  = G[v].center();
      rat_vector vec = G[w].point3() - G[w].point1();
      rat_point  cw  = cv + vec.rotate90();
      W.draw_ray(cv.to_point(),cw.to_point(),red);
    }

    else  { //both v and w proper nodes
      rat_point  cv  = G[v].center();
      rat_point  cw  = G[w].center();
      W.draw_segment(cv.to_point(),cw.to_point(),red);
    }
  }
  W.read_mouse();

  W.screenshot("voronoi_diagram");

  return 0;
}
See also:
Verification of Geometric Structures